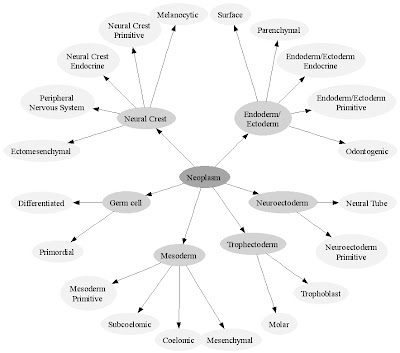
I have a small schematic, that represents the organization of the Neoplasm Classification.

In addition to this small schematic, I have a large schematic that represents the complete hierarchy of the Classification. Though it is too large to fit in this blog, each part of the schematic is quite simple.
It took a few seconds to create the complete diagram of the classification, in digraph (directed graph) form, using a short Perl script that parsed the Classification's RDF Schema + one command-line instruction to the free and open source GraphViz application.
Here's the script. As per usual, the following statement applies. The software is provided "as is", without warranty of any kind, express or implied, including but not limited to the warranties of merchantability, fitness for a particular purpose and noninfringement. in no event shall the authors or copyright holders be liable for any claim, damages or other liability, whether in an action of contract, tort or otherwise, arising from, out of or in connection with the software or the use or
other dealings in the software.
#!/usr/bin/perl
open (TEXT, "schema.txt");
open (OUT, ">schema.dot");
$/ = "\<\/rdfs\:Class>";
print OUT "digraph G \{\n";
print OUT  "size\=\"15\,15\"\;\n";
print OUT "ranksep\=\"2\.00\"\;\n";
$line = " ";
while ($line ne "")
  {
  $line = <TEXT>;
  last if ($line !~ /\<rdfs\:/);
  if ($line =~
/\:resource\=\"[a-z0-9\:\/\_\.\-]*\#([a-z\_]+)\"/i)
     {
     $father = $1;
     }
  if ($line =~ /rdf\:ID\=\"([a-z\_]+)\"/i)
     {
     $child = $1;
     }
   print OUT "$father \-\> $child\;\n";
   print "$father \-\> $child\;\n";
   }
print OUT "\}";
exit;
If you work with RDF (and every biomedical professional should understand how RDF is used to specify data), you will want a method that can instantaneously render a schematic of your RDF Schema (ontology) or of any descendant section of your Schema.
Tomorrow, I'll go into some detail to describe just how the Perl script produces a GraphViz script that can render an RDF Schema as a visual digraph.
- Jules Berman
My book, Principles of Big Data: Preparing, Sharing, and Analyzing Complex Information was published in 2013 year by Morgan Kaufmann.
I urge you to read more about my book. Google books has prepared a generous preview of the book contents. If you like the book, please request your librarian to purchase a copy of this book for your library or reading room.
tags: big data, metadata, data preparation, data analytics, data repurposing, datamining, data mining, medical autocoding, medical data scrubbing, medical data scrubber, medical record scrubbing, medical record scrubber, medical text parsing, medical autocoder, nomenclature, terminology, ontology, VizGraph, Neoplasm Classification, semantic web, ontologies, digraph, directed graph, tumor, cancer, tumour, neoplasia
