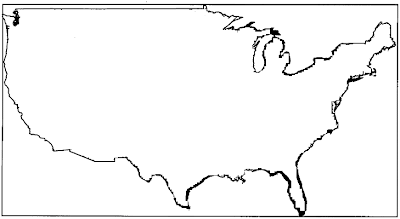
We started with a blank outline map of the U.S.

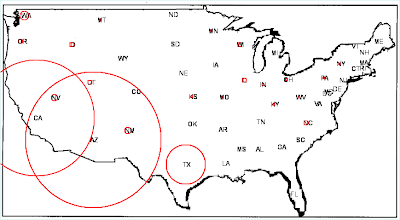
We finished with a map indicating the occurrences of coccidioidomycosis (as death certificate entries) in each state, and demonstrating the Southwest as an endemic area.

Each state has been "pasted" into the U.S. map. States with red circles contained cases of coccidioidomycosis recorded on death certificates; the diameter of circles is proportionate to the number of cases.
With a glance, we can see that coocidioidomycosis occurs primarily in the Southwest U.S. In fact, coccidioidomycosis, variously known as valley fever, San Joaquin Valley fever, California valley fever, and desert fever, is a fungal disease caused by Coccidioides immitis. In the U.S. this disease is endemic to certain parts of the Southwest.
The general method to make a data mashup map is as follows:
1. Find a map image, and determine the geographic boundaries of the map, in latitude and longitude.
In the case of the U.S. map, this is:
north border = 49 degrees latitude
south border = 25 degrees latitude
west border = 125 degrees longitude
east east = 66 degrees longitude
If we had geographic data on a smaller scale (e.g., a state, or a county, or a road or a river or a mountain range) we could have used a smaller map and all we'd need to change were the boundary values. The algorithm would be identical.
In general, the smaller the map the better. The reason for this is that the algorithm, as developed for our Perl script, needs a rectangular coordinate system. In large areas of the earth, surface curvature makes this difficult. When you project latitude-longitude points onto large area maps, using a simple proportionate scale, you can get some strange results. This is not a problem for maps that cover a small surface (i.e. a few hundred miles).
For yesterday's script, I used an outline map from the National Oceanic and Atmospheric Administration at:
http://www.nssl.noaa.gov/papers/techmemos/NWS-SR-193/images/fig7.gif
This image comes very close to being a recilinear map of the U.S.
2. The Ruby script requires the RMagick gem, the Ruby interface to the open source ImageMagick application.
Instructions for acquiring and installing RMagick are available from my web page:
http://www.julesberman.info/rubyhome.htm
Perl and Python also have interfaces to image methods, but I happen to find RMagick to be particularly easy to install and implement.
2. The Ruby script determines the boundaries of the map image, in pixels.
This is done with the imgage.columns method (to determine the width of the image in pixels) and the image.rows method (to determine the height of the image, in pixels).
3. All locations on the map can be determined by finding the proportionate number of pixels that account for the x,y distance (in latitude and longitude), and works from a list of the average latitude/longitude pairs for all of the continental states, plus the District of Columbia.
A list is available at:
http://www.maxmind.com/app/state_latlon
4. For each of the states, the Ruby script draws a circle, from the average latitude and logitude of the state, with a radius proportional to the number of cases of coccidioidomycoss reported in the CDC death certificate file, and prints the two-letter abbreviation for the state, a few pixels offsent from the circle's center.
lathash.each do
   |key,value|
   state = key
   latitude = value.to_f
   longitude = lonhash[key].to_f
   l_y =  (((north - latitude) / (north - south)) * height).ceil
   l_x =  (((west - longitude) / (west - east)) * width).ceil
   gc.fill_opacity(0)
   gc.stroke('red').stroke_width(1)
   circlesize = ((sizehash[state].to_f)*2).to_i
   gc.circle(l_x, l_y, (l_x - circlesize), l_y)
   gc.fill('black')
   gc.stroke('transparent')
   gc.text((l_x - 5), (l_y + 5), state)
   gc.draw(imgl)
end
If you want the script to display your finished image, you'll also need to include a widget module (I used Tk).
That's all there is to it. It takes a short while to get your supplementary files together and to install your required modules (if you don't already have these incredibly useful resources). The scripts are a few dozen lines in length, and many mashup projects can be done by simply tweaking these prototypical scripts. You can mashup disease data with anatomic images, or with cytogenetic images (chromosome maps), or with any image that relates a location to some quantitative data. The process is all basically the same.
In another blog for this series, we'll look at an example project where the raw data results may actually be more informative than the graphic visualization, and we'll discuss options for conveying undramatic data.
As I remind readers in almost every blog post, if you want to do your own creative data mining, you will need to learn a little about computer programming.
For Perl and Ruby programmers, methods and scripts for using a wide range of publicly available biomedical databases, are described in detail in my prior books:
Perl Programming for Medicine and Biology
Ruby Programming for Medicine and Biology
An overview of the many uses of biomedical information is available in my book,
Biomedical Informatics.
More information on cancer is available in my recently published book, Neoplasms: Principles of Development and Diversity.
In June, 2014, my book, entitled Rare Diseases and Orphan Drugs: Keys to Understanding and Treating the Common Diseases was published by Elsevier. The book builds the argument that our best chance of curing the common diseases will come from studying and curing the rare diseases.
I urge you to read more about my book. There's a generous preview of the book at the Google Books site. If you like the book, please request your librarian to purchase a copy of this book for your library or reading room.
© 2008 Jules Berman
As with all of my scripts, lists, web sites, and blog entries, the following disclaimer applies. This material is provided by its creator, Jules J. Berman, "as is", without warranty of any kind, expressed or implied, including but not limited to the warranties of merchantability, fitness for a particular purpose and noninfringement. in no event shall the author or copyright holder be liable for any claim, damages or other liability, whether in an action of contract, tort or otherwise, arising from, out of or in connection with the material or the use or other dealings.
tags: common disease, orphan disease, orphan drugs, rare disease, subsets of disease, disease genetics, genetics of complex disease, genetics of common diseases, ruby, perl, python, programming language, object-oriented programming, epidemiology, medical informatics
