Today, we'll show how we can use the CDC mortality data set to create a mashup, using short scripts written in Perl and Ruby. Readers of this blog who are specifically interested in the topic of Ruby-based mashups should also read Data Visualization with Ruby and RMagick - Where Are Those Bikes?, by LoGeek. LoGeek's elegant blog goes much further than mine to show how Ruby mashups can work with web service APIs.
Let's pretend that we know nothing about the geographic distribution of coccidioidomycosis (commonly misspelled coccidiomycosis). We can write a short Perl script that parses through every record in the CDC mortality file, pulling each death for which the diagnosis of coccidioidomycosis was recorded, and tallying the the deaths for the states in which the deceased death certificate was recorded. This will tell us something about the state-by-state distribution of coccidioidomycosis.
Here is a Perl script that produces a list of states and the tally of coccidioidomycosis cases, culled from the 1999 U.S. mortality file.
#/usr/local/bin/perl
open (STATE, "cdc_states.txt");
$line = " ";
while ($line ne "")
  {
  $line = <STATE>;
  $line =~ /^[0-9]{2}/;
  $state_code = $&;
  $line =~ / +([A-Z]{2}) *$/;
  $state_abb = $1;
  $statehash{$state_code} = $state_abb;
  }
close STATE;
open (ICD, "Mort99us.dat");
$line = " ";
while ($line ne "")
  {
  $line = <ICD>;
  $state = 0;
  $codesection = substr($line,161,140);
  if ($codesection =~ /B38/)
    {
    $code = substr($line,20,2);
    $state = $statehash{$code};
    $state_tally{$state}++;
    }
  }
open (MAP, ">state_count.txt");
while ((my $key, my $value) = each(%state_tally))
   {
   print "$key $value\n";
   print MAP "$key $value\n";
   }
exit
The output of the Perl script looks like this:
AZ 62
CA 53
ID 2
IL 2
IN 1
KS 1
KY 1
MN 1
MO 1
MT 1
NC 2
NM 3
NV 3
NY 1
OH 1
OR 2
PA 1
TX 18
UT 2
WA 4
WI 2
WV 1
You'll notice that fewer than 50 states are included in the list. States that had no cases of coccidioidomycosis were not added to the list. We will see that this does not effect the mashup.
How did the Perl script compile the occurrences of coccidioidomycosis in from the CDC mortality files?
The CDC mortality files include the state of record for the death certificate in bytes 21 and 22 of the record. Each state is provided with a unique two digit code. The codes, and their corresponding state name, are provided in the CDC data dictionary for the mortality file. I simply prepared a text file, cdc_states.txt, that listed all the 2-digit codes and the corresponding state abbreviations, so the raw CDC data could be converted to universally recognizable abbreviations.
The script parses through each record, and pulls the 140-byte section of the record that contains the ICD disease codes corresponding to the conditions registered in the death certificate. In the ICD, coccidioidomycosis matches "B38". The Perl script finds all of the records that match "B38" and increases the appropriate state (from byte 21 and 22) tally by one. After the entire file is parsed, it prints out the list of states that have cases of coccidioidomycosis, along with their tallies.
Once that's done, we can mashup the disease data into a map of the United States. I found a public domain outline map of the U.S. on the National Oceanographic and Atmospheric Associationon web site. I "erased" the interior of the map, leaving a minimalist outline of the U.S. upon which to project the state-specific data. You can use any map, so long as you know the longitude and latitude boundaries.

A Ruby script inserts the state data onto the U.S. map.
#!/usr/local/bin/ruby -w
require 'RMagick'
north = 49.to_f #degrees latitude
south = 25.to_f #degrees latitude
west = 125.to_f #degrees longitude
east = 66.to_f  #degrees longitude
#corresponds to the us continental extremities
text = File.open("c\:\\ftp\\loc_states.txt", "r")
lathash = Hash.new
lonhash = Hash.new
text.each do
    |line|
    line =~ /^([A-Z]{2})\,([0-9\.]+)\,\-?([\.0-9]+) *$/
    state = $1
    latitude = $2
    longitude = $3
    lathash[state] = latitude.to_f
    lonhash[state] = longitude.to_f
end
text.close
text = File.open("c\:\\ftp\\state_count.txt", "r")
sizehash = Hash.new
text.each do
    |line|
    line =~ / /
    state_abb = $`
    state_value = $'
    sizehash[state_abb] = state_value
end
text.close
imgl = Magick::ImageList.new("c\:\\ftp\\us\.gif")
width = imgl.columns
height = imgl.rows
gc = Magick::Draw.new
lathash.each do
   |key,value|
   state = key
   latitude = value.to_f
   longitude = lonhash[key].to_f
   l_y =  (((north - latitude) / (north - south)) * height).ceil
   l_x =  (((west - longitude) / (west - east)) * width).ceil
   gc.fill_opacity(0)
   gc.stroke('red').stroke_width(1)
   circlesize = ((sizehash[state].to_f)*2).to_i
   gc.circle(l_x, l_y, (l_x - circlesize), l_y)
   gc.fill('black')
   gc.stroke('transparent')
   gc.text((l_x - 5), (l_y + 5), state)
   gc.draw(imgl)
end
imgl.border!(1,1, 'lightcyan2')
imgl.write("circle.gif")
require 'tk'
root = TkRoot.new {title "view"}
TkButton.new(root) do
  image TkPhotoImage.new{file "circle.gif"}
  command {exit}
  pack
end
Tk.mainloop
exit
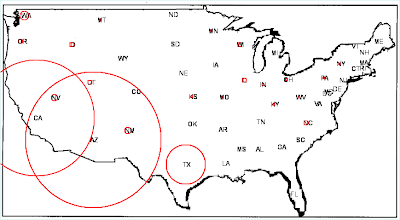
Here is the result.

Each state has been "pasted" into the U.S. map. States with red circles contained cases of coccidioidomycosis recorded on death certificates; the diameter of circles is proportionate to the number of cases.
With a glance, we can see that coocidiomycosis occurs primarily in the Southwest U.S. In fact, coccidioidomycosis, variously known as valley fever, San Joaquin Valley fever, California valley fever, and desert fever, is a fungal disease caused by Coccidioides immitis. In the U.S. this disease is endemic to certain parts of the Southwest.
This post has gotten lengthy. In the next blog post of the CDC mortality series, I'll explain how the Ruby mashup script works.
© 2008 Jules Berman
As with all of my scripts, lists, web sites, and blog entries, the following disclaimer applies. This material is provided by its creator, Jules J. Berman, "as is", without warranty of any kind, expressed or implied, including but not limited to the warranties of merchantability, fitness for a particular purpose and noninfringement. in no event shall the author or copyright holder be liable for any claim, damages or other liability, whether in an action of contract, tort or otherwise, arising from, out of or in connection with the material or the use or other dealings.

Image of C. immitis in sputum sample.
Some additional information on Coccidioidomycosis is available from my web site.
In June, 2014, my book, entitled Rare Diseases and Orphan Drugs: Keys to Understanding and Treating the Common Diseases was published by Elsevier. The book builds the argument that our best chance of curing the common diseases will come from studying and curing the rare diseases.
I urge you to read more about my book. There's a generous preview of the book at the Google Books site. If you like the book, please request your librarian to purchase a copy of this book for your library or reading room.
tags: epidemiology, neoplasms, Ruby programming, rare diseases, genetic diseases, orphan diseases, complex diseases, orphan drugs, cdc, death certificates, mortality data
